Generating Taxon Map Thumbnails
Each taxon in the taxonomic thesaurus has a Taxon Profile page that includes images, descriptions, links, and other data (when they exist) regarding that taxon. Using the Taxon Profile Map Thumbnail tool, a portal manager (superadministrator) can also generate thumbnail-sized distribution maps for taxa using record data from the portal. These maps can be dot maps or heat maps, and both rely entirely on the distributions of georeferenced records available in the portal. These maps must therefore be interpreted in the context of the geographic and/or taxonomic focus on the specific portal.
Navigate to the tool through the Sitemap by scrolling down to the Administrative Functions (Super Admins only) heading and clicking Manage Taxon Profile Map Thumbnails.
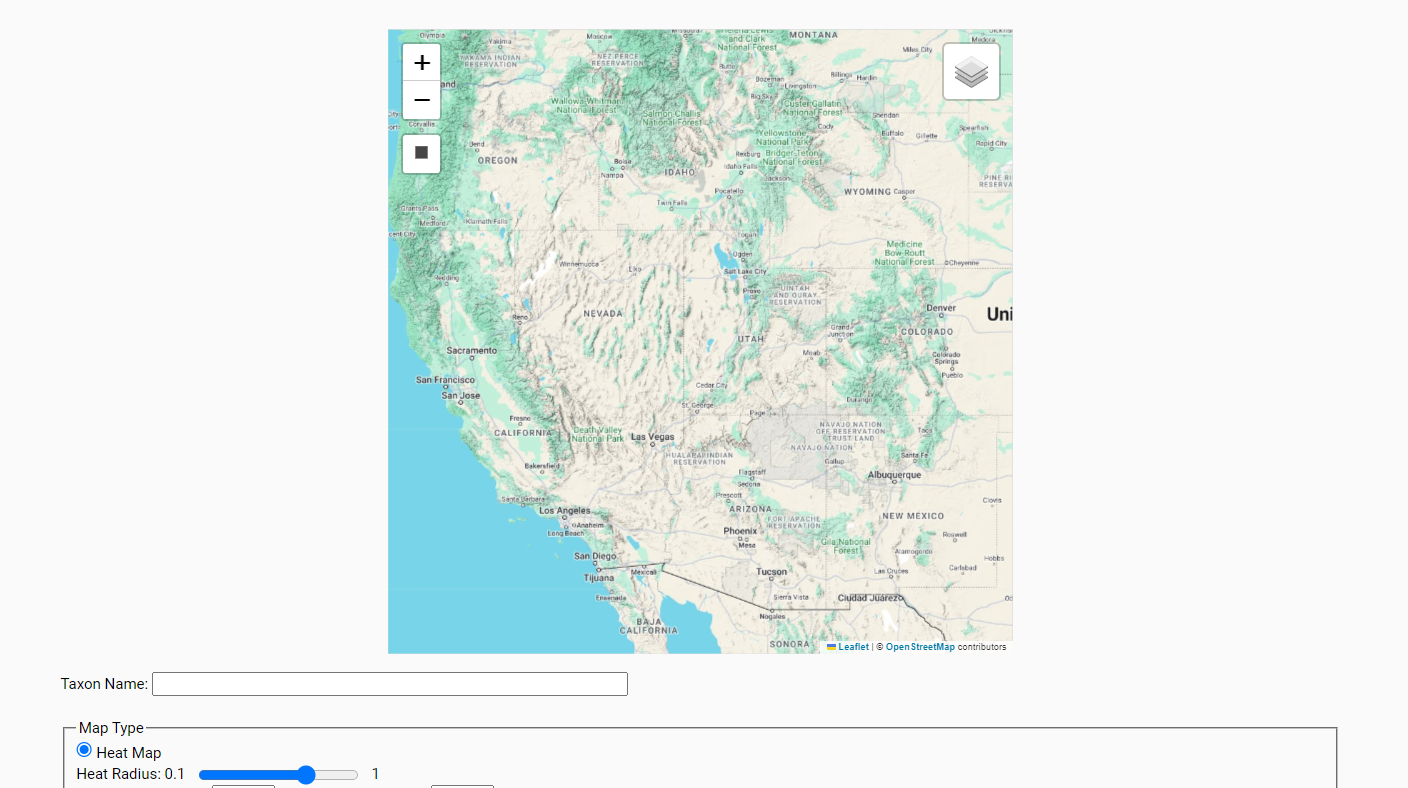
The map on the resulting page will be automatically centered to the default map coordinates as defined in the Symbini file. To adjust the bounds of the map, click and drag on the map, use the plus and minus buttons to zoom in or out, respectively, and/or use the rectangle drawing tool, which will zoom you closer to a specific area on the map. Double click the map to zoom in.
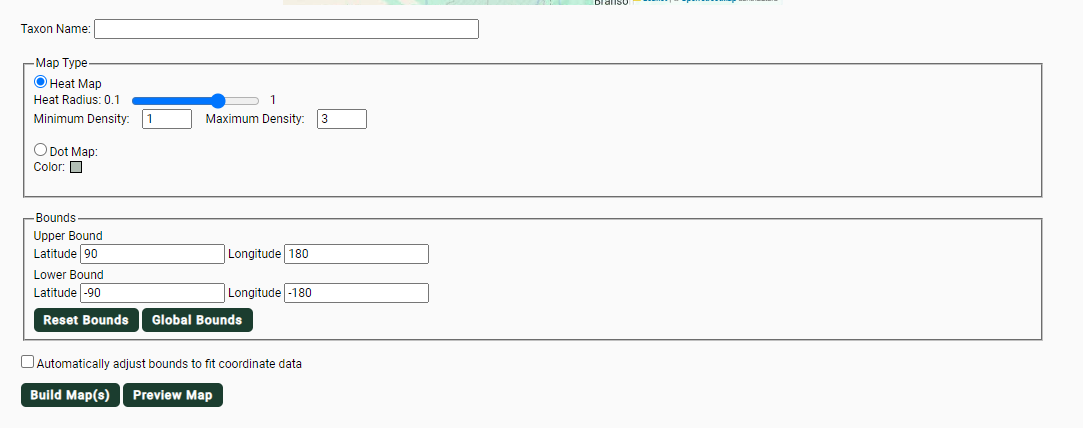
You can also manually set the boundaries of the map viewing box by editing the latitude and longitude values in the Bounds box. Click the “Global Bounds” button to represent a global map.
You can change the base layer of the map by clicking the layers icon in the top right corner of the map and selecting the appropriate radio button from the options.
Start typing the name of taxon for which you would like to generate a map in the “Taxon Name” field and select a matching taxon from the taxonomic thesaurus. If you can’t find your taxon of interest in the dropdown list, add it to the taxonomic thesaurus.
If you select a taxon with any children taxa (e.g., you select a genus or family name), clicking the “Build Map(s)” button will run through all the children taxa of that taxon and build thumbnail maps for all with available specimens using the parameters you have selected. A thumbnail map will not be created for the parent taxon (genus or family)
Adjust the parameters and click the “Preview Map” button to adjust the appearance of your thumbnail map. Depending on number of available records and the distribution of your taxon, you may need to play with the available parameters to produce a useful thumbnail.
- If you want to create a map of points where records are located, select the “Dot Map” option from the Map Type box. Select “Heat Map” for a heat map.
- Check the box next to “Automatically adjust bounds to fit coordinate data” if you would like the map boundaries to adjust automatically to include all the georeferenced records of that taxon.
- ⚠️ If you adjust the boundaries of the map manually and would like to keep those boundaries, make sure you uncheck the “Automatically adjust bounds to fit coordinate data” box before clicking “Build Map(s)”.
Once you are satisfied with the appearance of your map, click “Build Map(s)”.
Heat Map Parameters
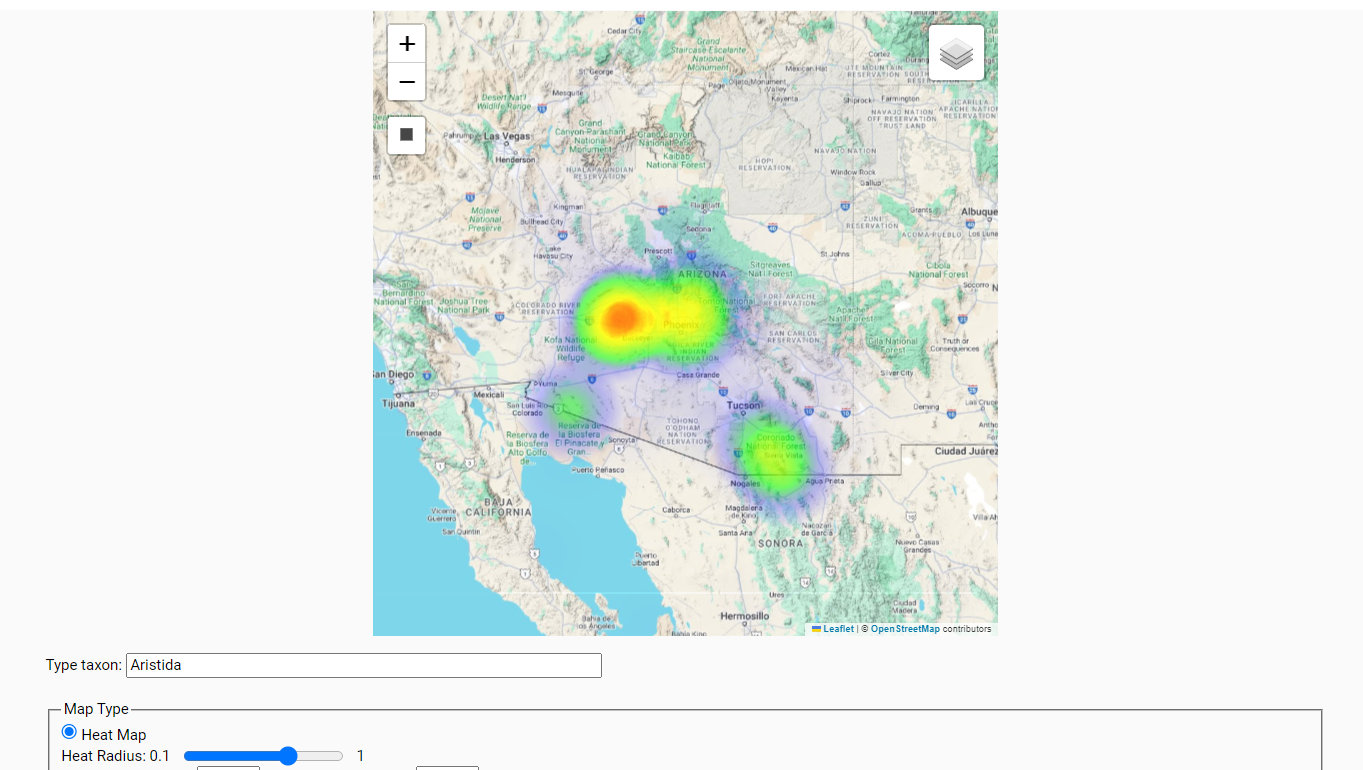
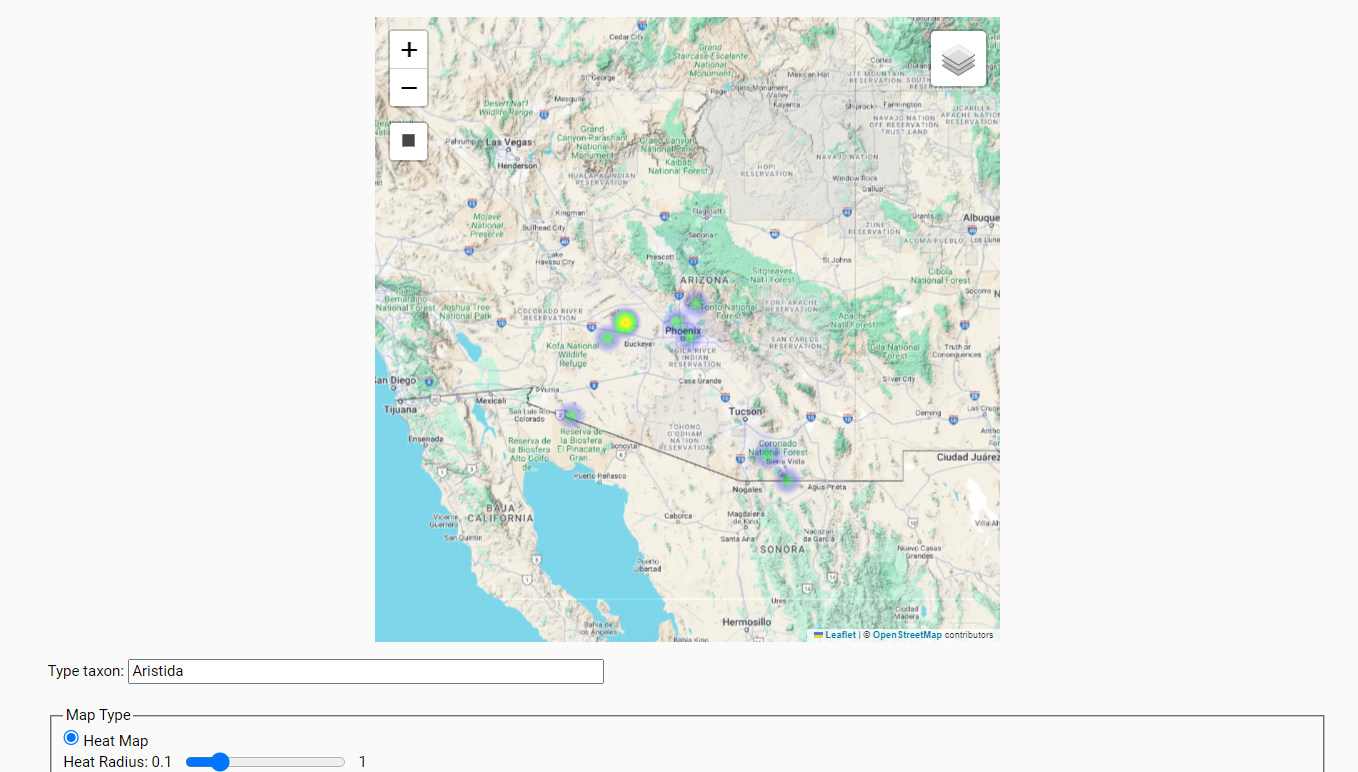
The appearance of the heat map can be adjusted by changing the heat radius (using the slider) and the heat density (using the minimum and maximum density fields).
A larger heat radius would mean that each point is represented by a larger colored area on the map.
Whereas a smaller heat radius makes each point represent a smaller colored area on the map.
Setting a smaller Minimum Density value will require a certain number of records to be present in an area before it will show up as “heat” on the map, and it will intensify the “heat” of locations with multiple records. Setting a larger Minimum Density value will lower the relative “heat” of hot spots.
Dot Map Parameters
To adjust the color of the map, click the grey square and adjust the hue and saturation in the pop-up box. Click outside of the pop-up box to close.
Cite this page:
Katie Pearson, ed: . Generating Taxon Map Thumbnails. In: Symbiota Support Hub (2025). Symbiota Documentation. https://biokic.github.io/symbiota-docs/portal_manager/taxonomy/thumbnails/. Created on 19 Feb 2023.


