Mapping NEON Bird Survey Monitoring Data to the Humboldt Extension for Ecological Inventories
Chandra Earl
2026-09-15
Introduction
This workflow has been created to map bird data from the National Ecological Observatory
Network (NEON) to Darwin Core and the Humboldt Extension for Ecological
Inventories. The workflow produces four Darwin Core tables: Event,
HumboldtEcologicalInventory, Occurrence, and
ExtendedMeasurementOrFact.
The dataset is structured hierarchically, with events defined at
multiple levels (project, domain, site, plot, point and point-count
survey). Occurrences represent observed birds. Contextual information on
sampling design, effort, and scope is expressed through Humboldt
Extension terms.
Introduction to NEON Bird Observations
NEON’s breeding landbird point count dataset provides taxonomic identifications, detection methods, and associated survey and site information for birds observed during standardized six-minute surveys. The protocol focuses on diurnal, terrestrial breeding landbirds, a group chosen because they respond strongly to changes in climate, habitat, and land use.
Field crews survey spatially distributed plots across NEON field sites during the breeding season every year, recording every bird seen or heard. These repeated surveys produce rich detection–nondetection data suited for occupancy modeling.
NEON’s terrestrial field sites are designated as large or small, which determines the sampling design. Large sites are surveyed once per year and contain 5–10 plots each containing a bird grid, made up of a 3×3 array of nine points spaced 250 m apart (see Figure 1). Field crews visit every point in a grid and conduct a 6-minute point-count survey. Smaller sites, which cannot accommodate full grids, contain 2–25 point-count locations randomly distributed across the site and spaced at least 250 m apart. These are surveyed twice per year.
Data Tip: NEON’s bird data follow a hierarchical structure: DomainID → SiteID → PlotID → PointID. Large sites use points labeled 1–9, while small sites use point label 21 for all locations. For example: (Large Site) D07 → GRSM → GRSM_002 → 5 | (Small Site) D20 → PUUM → PUUM_001 → 21.
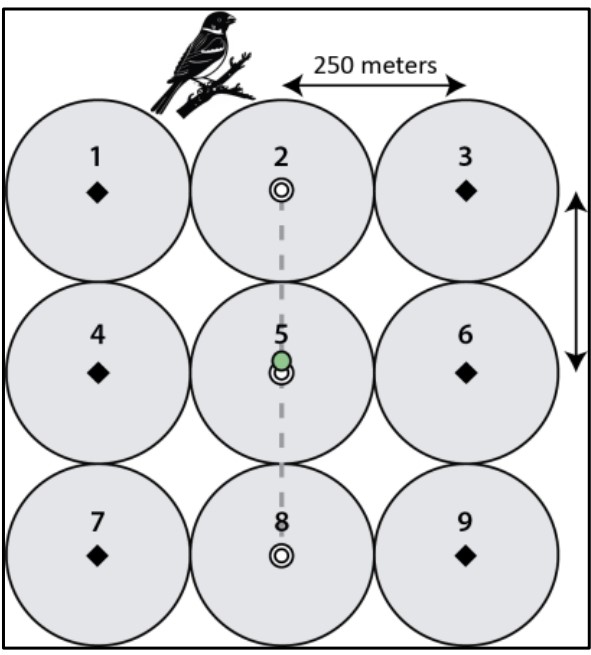
More details on NEON’s bird monitoring program are available on the NEON bird resource page. Protocols referenced in the data can be found in the Document Library.
Load libraries
The code examples in this document use R functions provided by the
neonUtilities package together with dplyr for
data manipulation. These libraries allow automated download and
processing of NEON data products to prepare them for mapping to Darwin
Core and the Humboldt Extension.
library(neonUtilities)
library(dplyr)
library(stringr)
library(httr2)
library(purrr)
library(tibble)
Download Data
The data used in this example come from one NEON data products: Breeding landbird point counts. This workflow uses data from RELEASE-2026.
- [NEON 2026] NEON (National Ecological Observatory Network) [1]. 2026. Breeding landbird point counts (DP1.10003.001), RELEASE-2026. https://doi.org/10.48443/v6hs-mx57. Dataset accessed from NEON Data Portal on 2026-09-14.
A NEON token was used to download the original data for this workflow. Tokens are optional but recommended, as they allow authenticated access and help avoid API rate limits when downloading large datasets. Users preparing their own mappings may wish to generate a personal token. For more information, see the Using an API Token when Accessing NEON Data with neonUtilities tutorial and the NEON API token documentation.
Get Bird data
if (!dir.exists("data")) {
  dir.create("data")
}

if (!dir.exists("outputs")) {
  dir.create("outputs")
}

if (!dir.exists("outputs/full")) {
  dir.create("outputs/full")
}

if (!dir.exists("outputs/zipped")) {
  dir.create("outputs/zipped")
}

if (file.exists("data/bird.occurrence.RData")) {
  load("data/bird.occurrence.RData")
} else {

  bird.occurrence <- loadByProduct(dpID="DP1.10003.001",
                                   package = "expanded",
                                   release = "RELEASE-2026",
                                   token = Sys.getenv("NEON_TOKEN"),
                                   check.size = F)

  save(bird.occurrence, file = "data/bird.occurrence.RData")
}
Map Data
NEON provides separate tables for point-count survey metadata
(brd_perpoint) and the bird counts themselves
(brd_countdata).
brd_perpoint contains fields describing the location,
elevation, date and field-crew recorded weather conditions for each
point-count survey.
str(bird.occurrence$brd_perpoint)## 'data.frame': 27076 obs. of 32 variables:
## $ uid : chr "30d14ecc-65a8-4e73-bcb3-d5132c153da2" "f97b6fa3-5719-4c0d-9922-1b23ec949911" "6fdac273-77b0-4e30-86d1-f6ff94f92e66" "ff9f059e-46fa-471a-a41d-2ac759881ff0" ...
## $ namedLocation : chr "BART_025.birdGrid.brd" "BART_025.birdGrid.brd" "BART_025.birdGrid.brd" "BART_025.birdGrid.brd" ...
## $ domainID : chr "D01" "D01" "D01" "D01" ...
## $ siteID : chr "BART" "BART" "BART" "BART" ...
## $ plotID : chr "BART_025" "BART_025" "BART_025" "BART_025" ...
## $ plotType : chr "distributed" "distributed" "distributed" "distributed" ...
## $ pointID : chr "3" "2" "1" "4" ...
## $ nlcdClass : chr "evergreenForest" "evergreenForest" "evergreenForest" "evergreenForest" ...
## $ decimalLatitude : num 44.1 44.1 44.1 44.1 44.1 ...
## $ decimalLongitude : num -71.3 -71.3 -71.3 -71.3 -71.3 ...
## $ geodeticDatum : chr "WGS84" "WGS84" "WGS84" "WGS84" ...
## $ coordinateUncertainty : num 250 250 250 250 250 ...
## $ elevation : num 576 576 576 576 576 ...
## $ elevationUncertainty : num 0.3 0.3 0.3 0.3 0.3 0.3 0.3 0.8 0.8 0.8 ...
## $ startDate : POSIXct, format: "2015-06-14 09:23:00" "2015-06-14 09:43:00" ...
## $ boutNumber : int 1 1 1 1 1 1 1 1 1 1 ...
## $ samplingImpracticalRemarks: chr NA NA NA NA ...
## $ samplingImpractical : chr "OK" "OK" "OK" "OK" ...
## $ eventID : chr "BRD.BART.2015.1" "BRD.BART.2015.1" "BRD.BART.2015.1" "BRD.BART.2015.1" ...
## $ startCloudCoverPercentage : int 20 20 20 20 20 20 20 100 100 100 ...
## $ endCloudCoverPercentage : int 40 40 40 40 40 40 40 100 100 100 ...
## $ startRH : int 72 72 72 72 72 72 72 93 93 93 ...
## $ endRH : int 56 56 56 56 56 56 56 85 85 85 ...
## $ observedHabitat : chr "evergreen forest" "deciduous forest" "mixed deciduous/evergreen forest" "deciduous forest" ...
## $ observedAirTemp : num 18 19 17 19 16 18 18 13 13 14 ...
## $ kmPerHourObservedWindSpeed: num 1 3 0 0 0 0 1 0 0 0 ...
## $ laboratoryName : chr "Bird Conservancy of the Rockies" "Bird Conservancy of the Rockies" "Bird Conservancy of the Rockies" "Bird Conservancy of the Rockies" ...
## $ samplingProtocolVersion : chr "NEON.DOC.014041vG" "NEON.DOC.014041vG" "NEON.DOC.014041vG" "NEON.DOC.014041vG" ...
## $ remarks : chr NA NA NA NA ...
## $ measuredBy : chr "JRUEB" "JRUEB" "JRUEB" "JRUEB" ...
## $ publicationDate : chr "20260106T223419Z" "20260106T223419Z" "20260106T223419Z" "20260106T223419Z" ...
## $ release : chr "RELEASE-2026" "RELEASE-2026" "RELEASE-2026" "RELEASE-2026" ...head(bird.occurrence$brd_perpoint, n=5)## uid namedLocation domainID siteID
## 1 30d14ecc-65a8-4e73-bcb3-d5132c153da2 BART_025.birdGrid.brd D01 BART
## 2 f97b6fa3-5719-4c0d-9922-1b23ec949911 BART_025.birdGrid.brd D01 BART
## 3 6fdac273-77b0-4e30-86d1-f6ff94f92e66 BART_025.birdGrid.brd D01 BART
## 4 ff9f059e-46fa-471a-a41d-2ac759881ff0 BART_025.birdGrid.brd D01 BART
## 5 e3f73906-fe6f-4f88-a05e-067a567d6516 BART_025.birdGrid.brd D01 BART
## plotID plotType pointID nlcdClass decimalLatitude decimalLongitude
## 1 BART_025 distributed 3 evergreenForest 44.06015 -71.31548
## 2 BART_025 distributed 2 evergreenForest 44.06015 -71.31548
## 3 BART_025 distributed 1 evergreenForest 44.06015 -71.31548
## 4 BART_025 distributed 4 evergreenForest 44.06015 -71.31548
## 5 BART_025 distributed 5 evergreenForest 44.06015 -71.31548
## geodeticDatum coordinateUncertainty elevation elevationUncertainty
## 1 WGS84 250.3 575.8 0.3
## 2 WGS84 250.3 575.8 0.3
## 3 WGS84 250.3 575.8 0.3
## 4 WGS84 250.3 575.8 0.3
## 5 WGS84 250.3 575.8 0.3
## startDate boutNumber samplingImpracticalRemarks samplingImpractical
## 1 2015-06-14 09:23:00 1 <NA> OK
## 2 2015-06-14 09:43:00 1 <NA> OK
## 3 2015-06-14 10:31:00 1 <NA> OK
## 4 2015-06-14 11:24:00 1 <NA> OK
## 5 2015-06-14 12:20:00 1 <NA> OK
## eventID startCloudCoverPercentage endCloudCoverPercentage startRH
## 1 BRD.BART.2015.1 20 40 72
## 2 BRD.BART.2015.1 20 40 72
## 3 BRD.BART.2015.1 20 40 72
## 4 BRD.BART.2015.1 20 40 72
## 5 BRD.BART.2015.1 20 40 72
## endRH observedHabitat observedAirTemp
## 1 56 evergreen forest 18
## 2 56 deciduous forest 19
## 3 56 mixed deciduous/evergreen forest 17
## 4 56 deciduous forest 19
## 5 56 deciduous forest 16
## kmPerHourObservedWindSpeed laboratoryName
## 1 1 Bird Conservancy of the Rockies
## 2 3 Bird Conservancy of the Rockies
## 3 0 Bird Conservancy of the Rockies
## 4 0 Bird Conservancy of the Rockies
## 5 0 Bird Conservancy of the Rockies
## samplingProtocolVersion remarks measuredBy publicationDate release
## 1 NEON.DOC.014041vG <NA> JRUEB 20260106T223419Z RELEASE-2026
## 2 NEON.DOC.014041vG <NA> JRUEB 20260106T223419Z RELEASE-2026
## 3 NEON.DOC.014041vG <NA> JRUEB 20260106T223419Z RELEASE-2026
## 4 NEON.DOC.014041vG <NA> JRUEB 20260106T223419Z RELEASE-2026
## 5 NEON.DOC.014041vG <NA> JRUEB 20260106T223419Z RELEASE-2026brd_countdata contains data for the birds observed
during each point-count survey, including identification, observation
method, distance, and observed minute.
str(bird.occurrence$brd_countdata)## 'data.frame': 373518 obs. of 28 variables:
## $ uid : chr "08b95360-854d-4d74-a276-93fc7d2423ca" "f2d2d4ce-c978-46a5-befb-4d3b749b1cdb" "754c7b57-1892-4f1f-9f49-594c40d47bfa" "6212a830-6d2d-4999-b169-19273526790e" ...
## $ namedLocation : chr "BART_025.birdGrid.brd" "BART_025.birdGrid.brd" "BART_025.birdGrid.brd" "BART_025.birdGrid.brd" ...
## $ domainID : chr "D01" "D01" "D01" "D01" ...
## $ siteID : chr "BART" "BART" "BART" "BART" ...
## $ plotID : chr "BART_025" "BART_025" "BART_025" "BART_025" ...
## $ plotType : chr "distributed" "distributed" "distributed" "distributed" ...
## $ pointID : chr "3" "3" "3" "3" ...
## $ startDate : POSIXct, format: "2015-06-14 09:23:00" "2015-06-14 09:23:00" ...
## $ boutNumber : int 1 1 1 1 1 1 1 1 1 1 ...
## $ eventID : chr "BRD.BART.2015.1" "BRD.BART.2015.1" "BRD.BART.2015.1" "BRD.BART.2015.1" ...
## $ pointCountMinute : int 1 1 2 2 1 3 4 1 1 6 ...
## $ targetTaxaPresent : chr "Y" "Y" "Y" "Y" ...
## $ taxonID : chr "REVI" "BTNW" "BTNW" "BAWW" ...
## $ scientificName : chr "Vireo olivaceus" "Setophaga virens" "Setophaga virens" "Mniotilta varia" ...
## $ taxonRank : chr "species" "species" "species" "species" ...
## $ vernacularName : chr "Red-eyed Vireo" "Black-throated Green Warbler" "Black-throated Green Warbler" "Black-and-white Warbler" ...
## $ family : chr "Vireonidae" "Parulidae" "Parulidae" "Parulidae" ...
## $ nativeStatusCode : chr "N" "N" "N" "N" ...
## $ observerDistance : num 9 12 50 17 42 27 62 26 21 46 ...
## $ detectionMethod : chr "singing" "singing" "singing" "singing" ...
## $ visualConfirmation : chr "No" "No" "No" "No" ...
## $ sexOrAge : chr "Male" "Male" "Male" "Male" ...
## $ clusterSize : int 1 1 1 1 1 1 1 1 1 1 ...
## $ clusterCode : chr NA NA NA NA ...
## $ identifiedBy : chr "JRUEB" "JRUEB" "JRUEB" "JRUEB" ...
## $ identificationHistoryID: chr NA NA NA NA ...
## $ publicationDate : chr "20260106T223419Z" "20260106T223419Z" "20260106T223419Z" "20260106T223419Z" ...
## $ release : chr "RELEASE-2026" "RELEASE-2026" "RELEASE-2026" "RELEASE-2026" ...head(bird.occurrence$brd_countdata, n=5)## uid namedLocation domainID siteID
## 1 08b95360-854d-4d74-a276-93fc7d2423ca BART_025.birdGrid.brd D01 BART
## 2 f2d2d4ce-c978-46a5-befb-4d3b749b1cdb BART_025.birdGrid.brd D01 BART
## 3 754c7b57-1892-4f1f-9f49-594c40d47bfa BART_025.birdGrid.brd D01 BART
## 4 6212a830-6d2d-4999-b169-19273526790e BART_025.birdGrid.brd D01 BART
## 5 192585ee-0a3d-4994-856f-3da8090a37c3 BART_025.birdGrid.brd D01 BART
## plotID plotType pointID startDate boutNumber eventID
## 1 BART_025 distributed 3 2015-06-14 09:23:00 1 BRD.BART.2015.1
## 2 BART_025 distributed 3 2015-06-14 09:23:00 1 BRD.BART.2015.1
## 3 BART_025 distributed 3 2015-06-14 09:23:00 1 BRD.BART.2015.1
## 4 BART_025 distributed 3 2015-06-14 09:23:00 1 BRD.BART.2015.1
## 5 BART_025 distributed 3 2015-06-14 09:23:00 1 BRD.BART.2015.1
## pointCountMinute targetTaxaPresent taxonID scientificName taxonRank
## 1 1 Y REVI Vireo olivaceus species
## 2 1 Y BTNW Setophaga virens species
## 3 2 Y BTNW Setophaga virens species
## 4 2 Y BAWW Mniotilta varia species
## 5 1 Y BCCH Poecile atricapillus species
## vernacularName family nativeStatusCode observerDistance
## 1 Red-eyed Vireo Vireonidae N 9
## 2 Black-throated Green Warbler Parulidae N 12
## 3 Black-throated Green Warbler Parulidae N 50
## 4 Black-and-white Warbler Parulidae N 17
## 5 Black-capped Chickadee Paridae N 42
## detectionMethod visualConfirmation sexOrAge clusterSize clusterCode
## 1 singing No Male 1 <NA>
## 2 singing No Male 1 <NA>
## 3 singing No Male 1 <NA>
## 4 singing No Male 1 <NA>
## 5 singing No Male 1 <NA>
## identifiedBy identificationHistoryID publicationDate release
## 1 JRUEB <NA> 20260106T223419Z RELEASE-2026
## 2 JRUEB <NA> 20260106T223419Z RELEASE-2026
## 3 JRUEB <NA> 20260106T223419Z RELEASE-2026
## 4 JRUEB <NA> 20260106T223419Z RELEASE-2026
## 5 JRUEB <NA> 20260106T223419Z RELEASE-2026Preparing the Data
Create unique IDs
Each point-count survey needs a unique identifier so that we can
match each point-count survey record (brd_perpoint) to its corresponding
bird data (brd_countdata). We extract the survey year from eventID and
then combine the site, plot, point, year, and bout into a single key
called pointSurveyID for each of the tables. Note, because the siteID is
already included in the plotID (e.g., BART_012), siteID is not actually
included in the construction of pointSurveyID.
#add pointLocationIDs
bird.occurrence$brd_perpoint <- bird.occurrence$brd_perpoint %>%
  mutate(year = str_extract(eventID, "\\d{4}")) %>%
  mutate(pointLocationID = paste(plotID, "point", pointID, sep = "_"))

bird.occurrence$brd_countdata <- bird.occurrence$brd_countdata %>%
  mutate(year = str_extract(eventID, "\\d{4}")) %>%
  mutate(pointLocationID = paste(plotID, "point", pointID, sep = "_"))

#add pointSurveyIDs
bird.occurrence$brd_perpoint <- bird.occurrence$brd_perpoint %>%
  mutate(year = str_extract(eventID, "\\d{4}")) %>%
  mutate(pointSurveyID = paste(plotID, "point", pointID, year, "bout", boutNumber, sep = "_"))

bird.occurrence$brd_countdata <- bird.occurrence$brd_countdata %>%
  mutate(year = str_extract(eventID, "\\d{4}")) %>%
mutate(pointSurveyID = paste(plotID, "point", pointID, year, "bout", boutNumber, sep = "_"))Map Event Core & Humboldt Data
The event hierarchy presented here follows the structure of NEON’s sampling design, with events defined at project, domain, site, plot, point, and individual sampling event (point-count survey) levels. Some event-level information is not provided directly in the NEON data download, such as details describing the overall project, individual domains, and sites. To capture the full hierarchy of the sampling design, these additional levels are reconstructed and included in the event table. The values are hard-coded based on latest (2025-09-24) NEON information.
Domain-level metadata was compiled from NEON documentation and geospatial files. A polygon shapefile defining NEON’s domain boundaries was downloaded from NEONDomains_2024.zip (last updated October 2024, CRS: Geographic WGS 84). Domain centroids (latitude and longitude) and associated uncertainty values were calculated from this shapefile using ArcGIS.
Site-level metadata was retrieved directly from NEON’s public API on September 24, 2025 using the field site metadata download (NEON_Field_Site_Metadata_20250924). This download represents a flattened subset of the full JSON objects returned by the locations/sites API endpoint.
All fields from the survey event table template are retained for completeness, even when particular values are not applicable for this dataset.
Project Event
The project event describes the overall bird monitoring program within NEON. It defines the scope of the survey (taxonomic, geographic, temporal), the general sampling protocols, and whether absence, abundance, and material samples are reported. The data for the Event Core and Humboldt extension are split into two separate files.
Mapping Event core fields for the project event level:
NEON_project_event_core <- data.frame(eventID = "NEON",
                                      parentEventID = NA,
                                      fieldNumber = NA,
                                      habitat = NA,
                                      locationID = NA,
                                      countryCode = "US",
                                      decimalLatitude = NA,
                                      decimalLongitude = NA,
                                      coordinateUncertaintyInMeters = NA,
                                      geodeticDatum = NA,
                                      locality = NA,
                                      sampleSizeValue = NA,
                                      sampleSizeUnit = NA,
                                      footprintWKT = NA,
                                      footprintSRS = NA,
                                      eventDate = paste(
                                        min(bird.occurrence$brd_perpoint$eventDate, na.rm = TRUE),
                                        max(bird.occurrence$brd_perpoint$eventDate, na.rm = TRUE),
                                        sep = "/"
                                      ),
                                      eventTime = NA,
                                      eventType = "project",
                                      samplingProtocol = "Point-count Survey",
                                      dataGeneralizations = NA,
                                      informationWithheld = NA,
                                      fieldNotes = NA,
                                      eventRemarks = NA,
                                      identifiedBy = NA
                                    )
Mapping Humboldt extension fields for the project event level:
NEON_project_event_humboldt <- data.frame(eventID = "NEON",
                                          siteNestingDescription = "Terrestrial field sites with breeding landbird point-count locations surveyed during standardized six-minute surveys. Large sites contain 5–10 plots, each with a 3x3 grid of nine points spaced 250 m apart and surveyed once per year; small sites contain 2–25 randomly distributed point-count locations spaced at least 250 m apart and surveyed twice per year.",
                                          siteCount = length(unique(bird.occurrence$brd_perpoint$pointLocationID)),
                                          verbatimSiteNames = paste(sort(unique(bird.occurrence$brd_perpoint$pointLocationID)), collapse = " | "),
                                          verbatimSiteDescriptions = NA,
                                          reportedWeather = NA,
                                          reportedExtremeConditions = NA,
                                          totalAreaSampledValue = NA,
                                          totalAreaSampledUnit = NA,
                                          geospatialScopeAreaValue = 9428288, #full geographic extent of USA-NEON boundaries
                                          geospatialScopeAreaUnit = "km²",
                                          isVegetationCoverReported = "false",
                                          eventDurationValue = NA,
                                          eventDurationUnit = NA,
                                          inventoryTypes = NA,
                                          compilationTypes = NA,
                                          compilationSourceTypes = NA,
                                          protocolNames = "Point-count Survey",
                                          protocolDescriptions = "Breeding landbirds are surveyed during standardized six-minute point counts conducted during the breeding season. Field crews visit designated point-count locations and record all birds seen or heard, including taxonomic identification and detection method. Large sites contain 3 x 3 grids of nine points spaced 250 m apart and are surveyed once per year, while small sites contain randomly distributed points spaced at least 250 m apart and are surveyed twice per year.",
                                          protocolReferences = "Esposito, R. 2024. TOS Protocol and Procedure: BRD – Breeding Landbird Abundance and Diversity. NEON.DOC.014041. NEON (National Ecological Observatory Network).",
                                          isAbsenceReported = NA,
                                          absentTaxa = NA,
                                          isAbundanceReported = "true",
                                          isAbundanceCapReported = "false",
                                          abundanceCap = NA,
                                          hasMaterialSamples = "false",
                                          materialSampleTypes = NA,
                                          hasVouchers = "false",
                                          voucherInstitutions = NA,
                                          isLeastSpecificTargetCategoryQuantityInclusive = "false",
                                          verbatimTargetScope = "birds",
                                          targetTaxonomicScope = "Aves",
                                          excludedTaxonomicScope = NA,
                                          isTaxonomicScopeFullyReported = "true",
                                          taxonCompletenessReported = "notReported",
                                          taxonCompletenessProtocols = "Standardized point-count surveys are designed to detect all diurnal terrestrial breeding landbird species seen or heard during the survey period.",
                                          hasNonTargetTaxa = "false",
                                          areNonTargetTaxaFullyReported = NA,
                                          nonTargetTaxa = NA,
                                          targetLifeStageScope = "adult | juvenile",
                                          excludedLifeStageScope = "egg | nestling",
                                          isLifeStageScopeFullyReported = "true",
                                          targetDegreeOfEstablishmentScope = NA,
                                          excludedDegreeOfEstablishmentScope = NA,
                                          isDegreeOfEstablishmentScopeFullyReported = NA,
                                          targetGrowthFormScope = NA,
                                          excludedGrowthFormScope = NA,
                                          isGrowthFormScopeFullyReported = NA,
                                          hasNonTargetOrganisms = NA,
                                          targetHabitatScope = NA,
                                          excludedHabitatScope = NA,
                                          samplingEffort = "6-minute point count per survey location",
                                          isSamplingEffortReported = "true",
                                          samplingEffortProtocol = "Birds are surveyed using standardized 6-minute point counts at each sampling location. Field crews record all birds seen or heard during the survey. Large sites contain 5–10 plots with nine points per grid and are surveyed once annually, while small sites contain 2–25 point-count locations and are surveyed twice annually.",
                                          samplingEffortValue = "6",
                                          samplingEffortUnit = "minutes per point-count survey",
                                          samplingPerformedBy = "NEON Field Staff"
                                        )
Domain Events
Domains represent NEON’s ecoclimatic regions. Each domain includes one or more terrestrial sites where bird sampling occurs.
Setup:
NEON_domain_metadata <- read.csv("data/NEON_Domain_Metadata_20250924.csv", stringsAsFactors = FALSE)

NEON_domain_list <- unique(bird.occurrence$brd_perpoint[, c("domainID")])

#index
domain_idx <- match(NEON_domain_list, NEON_domain_metadata$domain_id)
Mapping Event core fields for the domain event level:
added_domain_data_core <- data.frame(eventID = NEON_domain_metadata$domain_id[domain_idx],
                                      parentEventID = "NEON",
                                      fieldNumber = NA,
                                      habitat = NA,
                                      locationID = NEON_domain_metadata$domain_id[domain_idx],
                                      countryCode = "US",
                                      decimalLatitude = NEON_domain_metadata$decimalLatitude[domain_idx],
                                      decimalLongitude = NEON_domain_metadata$decimalLongitude[domain_idx],
                                      coordinateUncertaintyInMeters = NEON_domain_metadata$coordinateUncertaintyinMeters[domain_idx],
                                      geodeticDatum = "WGS84",
                                      locality = paste(NEON_domain_metadata$domain_name[domain_idx], " (", NEON_domain_metadata$domain_id[domain_idx], ")", sep = ""),
                                      sampleSizeValue = NA,
                                      sampleSizeUnit = NA,
                                      footprintWKT = NA,
                                      footprintSRS = NA,
                                      eventDate = tapply(
                                        bird.occurrence$brd_perpoint$eventDate,
                                        bird.occurrence$brd_perpoint$domainID,
                                        function(x) paste(min(x, na.rm = TRUE), max(x, na.rm = TRUE), sep = "/")
                                      )[NEON_domain_list],
                                      eventTime = NA,
                                      eventType = "survey", #eventType describes the event, not the internal vocabulary
                                      samplingProtocol = "Point-count Survey",
                                      dataGeneralizations = NA,
                                      informationWithheld = NA,
                                      fieldNotes = NA,
                                      eventRemarks = NA,
                                      identifiedBy = bird.occurrence$brd_countdata %>%
                                        group_by(domainID) %>%
                                        summarise(
                                          identifiedBy = paste(sort(unique(identifiedBy)), collapse = " | "),
                                          .groups = "drop"
                                        ) %>%
                                        right_join(data.frame(domainID = NEON_domain_list), by = "domainID") %>%
                                        arrange(match(domainID, NEON_domain_list)) %>%
                                        mutate(identifiedBy = ifelse(is.na(identifiedBy), NA, identifiedBy)) %>%
                                        pull(identifiedBy)
                                    )
Mapping Humboldt extension fields for the domain event level:
added_domain_data_humboldt <- data.frame(eventID = NEON_domain_metadata$domain_id[domain_idx],
                                          siteNestingDescription = "Each domain contains terrestrial field sites with plots containing designated point-count locations for breeding landbird surveys",
                                          siteCount = tapply(bird.occurrence$brd_perpoint$plotID,
                                                             bird.occurrence$brd_perpoint$domainID,
                                                             function(x) length(unique(x)))[NEON_domain_list],
                                          verbatimSiteNames = tapply(bird.occurrence$brd_perpoint$plotID,
                                                                     bird.occurrence$brd_perpoint$domainID,
                                                                     function(x) paste(sort(unique(x)), collapse = " | ")
                                                                   )[NEON_domain_list],
                                          verbatimSiteDescriptions = NA,
                                          reportedWeather = NA,
                                          reportedExtremeConditions = NA,
                                          totalAreaSampledValue = NA,
                                          totalAreaSampledUnit = NA,
                                          geospatialScopeAreaValue = NEON_domain_metadata$sq_km[domain_idx],
                                          geospatialScopeAreaUnit = "km²",
                                          isVegetationCoverReported = "false",
                                          eventDurationValue = NA,
                                          eventDurationUnit = NA,
                                          inventoryTypes = NA,
                                          compilationTypes = NA,
                                          compilationSourceTypes = NA,
                                          protocolNames = "Point-count Survey",
                                          protocolDescriptions = "Breeding landbirds are surveyed during standardized six-minute point counts conducted during the breeding season. Field crews visit designated point-count locations and record all birds seen or heard, including taxonomic identification and detection method. Large sites contain 3 x 3 grids of nine points spaced 250 m apart and are surveyed once per year, while small sites contain randomly distributed points spaced at least 250 m apart and are surveyed twice per year.",
                                          protocolReferences = "Esposito, R. 2024. TOS Protocol and Procedure: BRD – Breeding Landbird Abundance and Diversity. NEON.DOC.014041. NEON (National Ecological Observatory Network).",
                                          isAbsenceReported = NA,
                                          absentTaxa = NA,
                                          isAbundanceReported = "true",
                                          isAbundanceCapReported = "false",
                                          abundanceCap = NA,
                                          hasMaterialSamples = "false",
                                          materialSampleTypes = NA,
                                          hasVouchers = "false",
                                          voucherInstitutions = NA,
                                          isLeastSpecificTargetCategoryQuantityInclusive = "false",
                                          verbatimTargetScope = "birds",
                                          targetTaxonomicScope = "Aves",
                                          excludedTaxonomicScope = NA,
                                          isTaxonomicScopeFullyReported = "true",
                                          taxonCompletenessReported = "notReported",
                                          taxonCompletenessProtocols = "Standardized point-count surveys are designed to detect all diurnal terrestrial breeding landbird species seen or heard during the survey period.",
                                          hasNonTargetTaxa = "false",
                                          areNonTargetTaxaFullyReported = NA,
                                          nonTargetTaxa = NA,
                                          targetLifeStageScope = "adult | juvenile",
                                          excludedLifeStageScope = "egg | nestling",
                                          isLifeStageScopeFullyReported = "true",
                                          targetDegreeOfEstablishmentScope = NA,
                                          excludedDegreeOfEstablishmentScope = NA,
                                          isDegreeOfEstablishmentScopeFullyReported = NA,
                                          targetGrowthFormScope = NA,
                                          excludedGrowthFormScope = NA,
                                          isGrowthFormScopeFullyReported = NA,
                                          hasNonTargetOrganisms = NA,
                                          targetHabitatScope = NA,
                                          excludedHabitatScope = NA,
                                          samplingEffort = "6-minute point count per survey location",
                                          isSamplingEffortReported = "true",
                                          samplingEffortProtocol = "Birds are surveyed using standardized 6-minute point counts at each sampling location. Field crews record all birds seen or heard during the survey. Large sites contain 5–10 plots with nine points per grid and are surveyed once annually, while small sites contain 2–25 point-count locations and are surveyed twice annually.",
                                          samplingEffortValue = "6",
                                          samplingEffortUnit = "minutes per point-count survey",
                                          samplingPerformedBy = tapply(
                                            bird.occurrence$brd_perpoint$measuredBy,
                                            bird.occurrence$brd_perpoint$domainID,
                                            function(x) paste(sort(unique(x)), collapse = " | ")
                                          )[NEON_domain_metadata$domain_id]
                                        )
Site Events
Each NEON terrestrial site contains designated locations for breeding landbird point-count surveys. Large sites contain 5–10 plots, each with a 3×3 grid of nine points spaced 250 m apart, while small sites contain 2–25 randomly distributed point-count locations spaced at least 250 m apart. Site events record location metadata, habitat information, and elevation.
Setup:
NEON_site_metadata <- read.csv(
  "https://www.neonscience.org/field-sites/exports/NEON_Field_Site_Metadata_20250924",
  stringsAsFactors = FALSE
)

NEON_site_list <- unique(bird.occurrence$brd_perpoint[, c("siteID")])

#indexes
site_idx <- match(NEON_site_list, NEON_site_metadata$site_id)
Mapping Event core fields for the site event level:
added_site_data_core <- data.frame(eventID = NEON_site_metadata$site_id[site_idx],
                                    parentEventID = NEON_site_metadata$domain_id[site_idx],
                                    fieldNumber = NA,
                                    habitat = gsub("\\|", " | ", NEON_site_metadata$dominant_nlcd_classes[site_idx]),
                                    locationID = NEON_site_metadata$site_id[site_idx],
                                    countryCode = "US",
                                    county = NEON_site_metadata$site_county[site_idx],
                                    stateProvince = NEON_site_metadata$site_state[site_idx],
                                    decimalLatitude = NEON_site_metadata$latitude[site_idx],
                                    decimalLongitude = NEON_site_metadata$longitude[site_idx],
                                    coordinateUncertaintyInMeters = NA,
                                    geodeticDatum = "WGS84",
                                    locality = paste(NEON_site_metadata$site_name[site_idx], " (", NEON_site_metadata$site_id[site_idx], ")", sep = ""),
                                    minimumElevationInMeters = NEON_site_metadata$minimum_elevation_m[site_idx],
                                    maximumElevationInMeters = NEON_site_metadata$maximum_elevation_m[site_idx],
                                    verbatimElevation = paste(NEON_site_metadata$mean_evelation_m[site_idx], "m", sep=""),
                                    sampleSizeValue = NA,
                                    sampleSizeUnit = NA,
                                    footprintWKT = NA,
                                    footprintSRS = NA,
                                    eventDate = tapply(
                                      bird.occurrence$brd_perpoint$eventDate,
                                      bird.occurrence$brd_perpoint$siteID,
                                      function(x) paste(min(x, na.rm = TRUE), max(x, na.rm = TRUE), sep = "/")
                                    )[NEON_site_list],
                                    eventTime = NA,
                                    eventType = "survey",
                                    samplingProtocol = "Point-count Survey",
                                    dataGeneralizations = NA,
                                    informationWithheld = NA,
                                    fieldNotes = NA,
                                    eventRemarks = NA,
                                    identifiedBy = bird.occurrence$brd_countdata %>%
                                      group_by(siteID) %>%
                                      summarise(
                                        identifiedBy = paste(sort(unique(identifiedBy)), collapse = " | "),
                                        .groups = "drop"
                                      ) %>%
                                      right_join(data.frame(siteID = NEON_site_list), by = "siteID") %>%
                                      arrange(match(siteID, NEON_site_list)) %>%
                                      mutate(identifiedBy = ifelse(is.na(identifiedBy), NA, identifiedBy)) %>%
                                      pull(identifiedBy)
                                  )
Mapping Humboldt extension fields for the site event level:
added_site_data_humboldt <- data.frame(eventID = NEON_site_metadata$site_id[site_idx],
                                        siteNestingDescription = "Each domain contains terrestrial field sites with plots containing designated point-count locations for breeding landbird surveys",
                                        siteCount = tapply(bird.occurrence$brd_perpoint$plotID,
                                                           bird.occurrence$brd_perpoint$siteID,
                                                           function(x) length(unique(x)))[NEON_site_list],
                                        verbatimSiteNames = tapply(bird.occurrence$brd_perpoint$plotID,
                                                                   bird.occurrence$brd_perpoint$siteID,
                                                                   function(x) paste(sort(unique(x)), collapse = " | ")
                                                                 )[NEON_site_list],
                                        verbatimSiteDescriptions = NEON_site_metadata$site_type[site_idx],
                                        reportedWeather = NA,
                                        reportedExtremeConditions = NA,
                                        totalAreaSampledValue = NA,
                                        totalAreaSampledUnit = NA,
                                        geospatialScopeAreaValue = NEON_site_metadata$terrestrial_sampling_boundary_size_km2[site_idx],
                                        geospatialScopeAreaUnit = "km²",
                                        isVegetationCoverReported = "false",
                                        eventDurationValue = NA,
                                        eventDurationUnit = NA,
                                        inventoryTypes = NA,
                                        compilationTypes = NA,
                                        compilationSourceTypes = NA,
                                        protocolNames = "Point-count Survey",
                                        protocolDescriptions = "Breeding landbirds are surveyed during standardized six-minute point counts conducted during the breeding season. Field crews visit designated point-count locations and record all birds seen or heard, including taxonomic identification and detection method. Large sites contain 3 x 3 grids of nine points spaced 250 m apart and are surveyed once per year, while small sites contain randomly distributed points spaced at least 250 m apart and are surveyed twice per year.",
                                        protocolReferences = "Esposito, R. 2024. TOS Protocol and Procedure: BRD – Breeding Landbird Abundance and Diversity. NEON.DOC.014041. NEON (National Ecological Observatory Network).",
                                        isAbsenceReported = NA,
                                        absentTaxa = NA,
                                        isAbundanceReported = "true",
                                        isAbundanceCapReported = "false",
                                        abundanceCap = NA,
                                        hasMaterialSamples = "false",
                                        materialSampleTypes = NA,
                                        hasVouchers = "false",
                                        voucherInstitutions = NA,
                                        isLeastSpecificTargetCategoryQuantityInclusive = "false",
                                        verbatimTargetScope = "birds",
                                        targetTaxonomicScope = "Aves",
                                        excludedTaxonomicScope = NA,
                                        isTaxonomicScopeFullyReported = "true",
                                        taxonCompletenessReported = "notReported",
                                        taxonCompletenessProtocols = "Standardized point-count surveys are designed to detect all diurnal terrestrial breeding landbird species seen or heard during the survey period.",
                                        hasNonTargetTaxa = "false",
                                        areNonTargetTaxaFullyReported = NA,
                                        nonTargetTaxa = NA,
                                        targetLifeStageScope = "adult | juvenile",
                                        excludedLifeStageScope = "egg | nestling",
                                        isLifeStageScopeFullyReported = "true",
                                        targetDegreeOfEstablishmentScope = NA,
                                        excludedDegreeOfEstablishmentScope = NA,
                                        isDegreeOfEstablishmentScopeFullyReported = NA,
                                        targetGrowthFormScope = NA,
                                        excludedGrowthFormScope = NA,
                                        isGrowthFormScopeFullyReported = NA,
                                        hasNonTargetOrganisms = NA,
                                        targetHabitatScope = NA,
                                        excludedHabitatScope = NA,
                                        samplingEffort = "6-minute point count per survey location",
                                        isSamplingEffortReported = "true",
                                        samplingEffortProtocol = "Birds are surveyed using standardized 6-minute point counts at each sampling location. Field crews record all birds seen or heard during the survey. Large sites contain 5–10 plots with nine points per grid and are surveyed once annually, while small sites contain 2–25 point-count locations and are surveyed twice annually.",
                                        samplingEffortValue = "6",
                                        samplingEffortUnit = "minutes per point-count survey",
                                        samplingPerformedBy = bird.occurrence$brd_perpoint %>%
                                          group_by(siteID) %>%
                                          summarise(
                                            samplingPerformedBy = paste(
                                              sort(unique(measuredBy[!is.na(measuredBy)])),
                                              collapse = " | "
                                            ),
                                            .groups = "drop"
                                          ) %>%
                                          right_join(data.frame(siteID = NEON_site_list), by = "siteID") %>%
                                          arrange(match(siteID, NEON_site_list)) %>%
                                          mutate(
                                            samplingPerformedBy = ifelse(
                                              samplingPerformedBy == "",
                                              NA,
                                              samplingPerformedBy
                                            )
                                          ) %>%
                                          pull(samplingPerformedBy)
                                      )
Plot Events
Plot events represent spatial sampling units within NEON’s breeding landbird monitoring design. At large sites, each plot contains a 3×3 grid of nine point-count locations spaced 250 m apart. At small sites, plots contain a single point-count location. Plot-level metadata include plot identifiers, habitat information, and elevation.
Setup:
NEON_plot_metadata <- unique(bird.occurrence$brd_perpoint[, c("namedLocation",
                                                               "siteID",
                                                               "plotID",
                                                               "plotType",
                                                               "nlcdClass",
                                                               "decimalLatitude",
                                                               "decimalLongitude",
                                                               "geodeticDatum",
                                                               "coordinateUncertainty",
                                                               "elevation",
                                                               "elevationUncertainty")])
Mapping Event core fields for the plot event level:
added_plot_data_core <- data.frame(eventID = NEON_plot_metadata$plotID,
                                    parentEventID = NEON_plot_metadata$siteID,
                                    fieldNumber = NA,
                                    habitat = NEON_plot_metadata$nlcdClass,
                                    locationID = NEON_plot_metadata$plotID,
                                    countryCode = "US",
                                    decimalLatitude = NEON_plot_metadata$decimalLatitude,
                                    decimalLongitude = NEON_plot_metadata$decimalLongitude,
                                    coordinateUncertaintyInMeters = NEON_plot_metadata$coordinateUncertainty,
                                    geodeticDatum = "WGS84",
                                    locality = NEON_plot_metadata$plotID,
                                    minimumElevationInMeters = NEON_plot_metadata$elevation - NEON_plot_metadata$elevationUncertainty,
                                    maximumElevationInMeters = NEON_plot_metadata$elevation + NEON_plot_metadata$elevationUncertainty,
                                    verbatimElevation = paste(NEON_plot_metadata$elevation, "m", sep=""),
                                    sampleSizeValue = NA,
                                    sampleSizeUnit = NA,
                                    footprintWKT = NA,
                                    footprintSRS = NA,
                                    eventDate = tapply(
                                      bird.occurrence$brd_perpoint$eventDate,
                                      bird.occurrence$brd_perpoint$plotID,
                                      function(x) paste(min(x, na.rm = TRUE), max(x, na.rm = TRUE), sep = "/")
                                    )[NEON_plot_metadata$plotID],
                                    eventTime = NA,
                                    eventType = "survey",
                                    samplingProtocol = "Point-count Survey",
                                    dataGeneralizations = NA,
                                    informationWithheld = NA,
                                    fieldNotes = NA,
                                    eventRemarks = NA,
                                    identifiedBy = tapply(
                                      bird.occurrence$brd_countdata$identifiedBy,
                                      bird.occurrence$brd_countdata$plotID,
                                      function(x) paste(sort(unique(x)), collapse = " | ")
                                    )[NEON_plot_metadata$plotID]
                                  )
Mapping Humboldt extension fields for the plot event level:
added_plot_data_humboldt <- data.frame(eventID = NEON_plot_metadata$plotID,
                                        siteNestingDescription = "One plot containing designated breeding landbird point-count locations",
                                        siteCount = 1,
                                        verbatimSiteNames = NEON_plot_metadata$plotID,
                                        verbatimSiteDescriptions = NA,
                                        reportedWeather = NA,
                                        reportedExtremeConditions = NA,
                                        totalAreaSampledValue = NA,
                                        totalAreaSampledUnit = NA,
                                        geospatialScopeAreaValue = NA,
                                        geospatialScopeAreaUnit = NA,
                                        isVegetationCoverReported = "false",
                                        eventDurationValue = NA,
                                        eventDurationUnit = NA,
                                        inventoryTypes = NA,
                                        compilationTypes = NA,
                                        compilationSourceTypes = NA,
                                        protocolNames = "Point-count Survey",
                                        protocolDescriptions = "Breeding landbirds are surveyed during standardized six-minute point counts conducted during the breeding season. Field crews visit designated point-count locations and record all birds seen or heard, including taxonomic identification and detection method. Large sites contain 3 x 3 grids of nine points spaced 250 m apart and are surveyed once per year, while small sites contain randomly distributed points spaced at least 250 m apart and are surveyed twice per year.",
                                        protocolReferences = "Esposito, R. 2024. TOS Protocol and Procedure: BRD – Breeding Landbird Abundance and Diversity. NEON.DOC.014041. NEON (National Ecological Observatory Network).",
                                        isAbsenceReported = NA,
                                        absentTaxa = NA,
                                        isAbundanceReported = "true",
                                        isAbundanceCapReported = "false",
                                        abundanceCap = NA,
                                        hasMaterialSamples = "false",
                                        materialSampleTypes = NA,
                                        hasVouchers = "false",
                                        voucherInstitutions = NA,
                                        isLeastSpecificTargetCategoryQuantityInclusive = "false",
                                        verbatimTargetScope = "birds",
                                        targetTaxonomicScope = "Aves",
                                        excludedTaxonomicScope = NA,
                                        isTaxonomicScopeFullyReported = "true",
                                        taxonCompletenessReported = "notReported",
                                        taxonCompletenessProtocols = "Standardized point-count surveys are designed to detect all diurnal terrestrial breeding landbird species seen or heard during the survey period.",
                                        hasNonTargetTaxa = "false",
                                        areNonTargetTaxaFullyReported = NA,
                                        nonTargetTaxa = NA,
                                        targetLifeStageScope = "adult | juvenile",
                                        excludedLifeStageScope = "egg | nestling",
                                        isLifeStageScopeFullyReported = "true",
                                        targetDegreeOfEstablishmentScope = NA,
                                        excludedDegreeOfEstablishmentScope = NA,
                                        isDegreeOfEstablishmentScopeFullyReported = NA,
                                        targetGrowthFormScope = NA,
                                        excludedGrowthFormScope = NA,
                                        isGrowthFormScopeFullyReported = NA,
                                        hasNonTargetOrganisms = NA,
                                        targetHabitatScope = NA,
                                        excludedHabitatScope = NA,
                                        samplingEffort = "6-minute point count per survey location",
                                        isSamplingEffortReported = "true",
                                        samplingEffortProtocol = "Birds are surveyed using standardized 6-minute point counts at each sampling location. Field crews record all birds seen or heard during the survey. Large sites contain 5–10 plots with nine points per grid and are surveyed once annually, while small sites contain 2–25 point-count locations and are surveyed twice annually.",
                                        samplingEffortValue = "6",
                                        samplingEffortUnit = "minutes per point-count survey",
                                        samplingPerformedBy = tapply(
                                          bird.occurrence$brd_perpoint$measuredBy,
                                          bird.occurrence$brd_perpoint$plotID,
                                          function(x) paste(sort(unique(x)), collapse = " | ")
                                        )[NEON_plot_metadata$plotID]
                                      )
Point Events
Point events represent the smallest sampling units within NEON’s breeding landbird monitoring design. At large sites, each plot contains a 3×3 grid of nine point-count locations spaced 250 m apart. At small sites, plots contain a single point-count location.
Setup:
NEON_point_metadata <- bird.occurrence$brd_perpoint %>%
  group_by(pointLocationID) %>%
  summarise(
    plotID = first(plotID),
    observedHabitat = paste(
      sort(unique(observedHabitat[!is.na(observedHabitat)])),
      collapse = " | "
    ),
    .groups = "drop"
  )
Mapping Event core fields for the point event level:
added_point_data_core <- data.frame(eventID = NEON_point_metadata$pointLocationID,
                                    parentEventID = NEON_point_metadata$plotID,
                                    fieldNumber = NA,
                                    habitat = NEON_point_metadata$observedHabitat,
                                    locationID = NEON_point_metadata$pointLocationID,
                                    countryCode = "US",
                                    decimalLatitude = NA,
                                    decimalLongitude = NA,
                                    coordinateUncertaintyInMeters = NA,
                                    geodeticDatum = NA,
                                    locality = NEON_point_metadata$pointLocationID,
                                    minimumElevationInMeters = NA,
                                    maximumElevationInMeters = NA,
                                    verbatimElevation = NA,
                                    sampleSizeValue = NA,
                                    sampleSizeUnit = NA,
                                    footprintWKT = NA,
                                    footprintSRS = NA,
                                    eventDate = tapply(
                                      bird.occurrence$brd_perpoint$eventDate,
                                      bird.occurrence$brd_perpoint$pointLocationID,
                                      function(x) paste(min(x, na.rm = TRUE), max(x, na.rm = TRUE), sep = "/")
                                    )[NEON_point_metadata$pointLocationID],
                                    eventTime = NA,
                                    eventType = "survey",
                                    samplingProtocol = "Point-count Survey",
                                    dataGeneralizations = NA,
                                    informationWithheld = NA,
                                    fieldNotes = NA,
                                    eventRemarks = NA,
                                    identifiedBy = tapply(
                                      bird.occurrence$brd_countdata$identifiedBy,
                                      bird.occurrence$brd_countdata$pointLocationID,
                                      function(x) paste(sort(unique(x)), collapse = " | ")
                                    )[NEON_point_metadata$pointLocationID]
                                  )
Mapping Humboldt extension fields for the point event level:
added_point_data_humboldt <- data.frame(eventID = NEON_point_metadata$pointLocationID,
                                        siteNestingDescription = "One designated breeding landbird point-count location",
                                        siteCount = 1,
                                        verbatimSiteNames = NEON_point_metadata$pointLocationID,
                                        verbatimSiteDescriptions = NA,
                                        reportedWeather = NA,
                                        reportedExtremeConditions = NA,
                                        totalAreaSampledValue = NA,
                                        totalAreaSampledUnit = NA,
                                        geospatialScopeAreaValue = NA,
                                        geospatialScopeAreaUnit = NA,
                                        isVegetationCoverReported = "false",
                                        eventDurationValue = NA,
                                        eventDurationUnit = NA,
                                        inventoryTypes = NA,
                                        compilationTypes = NA,
                                        compilationSourceTypes = NA,
                                        protocolNames = "Point-count Survey",
                                        protocolDescriptions = "Breeding landbirds are surveyed during standardized six-minute point counts conducted during the breeding season. Field crews visit designated point-count locations and record all birds seen or heard, including taxonomic identification and detection method. Large sites contain 3 x 3 grids of nine points spaced 250 m apart and are surveyed once per year, while small sites contain randomly distributed points spaced at least 250 m apart and are surveyed twice per year.",
                                        protocolReferences = "Esposito, R. 2024. TOS Protocol and Procedure: BRD – Breeding Landbird Abundance and Diversity. NEON.DOC.014041. NEON (National Ecological Observatory Network).",
                                        isAbsenceReported = NA,
                                        absentTaxa = NA,
                                        isAbundanceReported = "true",
                                        isAbundanceCapReported = "false",
                                        abundanceCap = NA,
                                        hasMaterialSamples = "false",
                                        materialSampleTypes = NA,
                                        hasVouchers = "false",
                                        voucherInstitutions = NA,
                                        isLeastSpecificTargetCategoryQuantityInclusive = "false",
                                        verbatimTargetScope = "birds",
                                        targetTaxonomicScope = "Aves",
                                        excludedTaxonomicScope = NA,
                                        isTaxonomicScopeFullyReported = "true",
                                        taxonCompletenessReported = "notReported",
                                        taxonCompletenessProtocols = "Standardized point-count surveys are designed to detect all diurnal terrestrial breeding landbird species seen or heard during the survey period.",
                                        hasNonTargetTaxa = "false",
                                        areNonTargetTaxaFullyReported = NA,
                                        nonTargetTaxa = NA,
                                        targetLifeStageScope = "adult | juvenile",
                                        excludedLifeStageScope = "egg | nestling",
                                        isLifeStageScopeFullyReported = "true",
                                        targetDegreeOfEstablishmentScope = NA,
                                        excludedDegreeOfEstablishmentScope = NA,
                                        isDegreeOfEstablishmentScopeFullyReported = NA,
                                        targetGrowthFormScope = NA,
                                        excludedGrowthFormScope = NA,
                                        isGrowthFormScopeFullyReported = NA,
                                        hasNonTargetOrganisms = NA,
                                        targetHabitatScope = NA,
                                        excludedHabitatScope = NA,
                                        samplingEffort = "6-minute point count per survey location",
                                        isSamplingEffortReported = "true",
                                        samplingEffortProtocol = "Birds are surveyed using standardized 6-minute point counts at each sampling location. Field crews record all birds seen or heard during the survey. Large sites contain 5–10 plots with nine points per grid and are surveyed once annually, while small sites contain 2–25 point-count locations and are surveyed twice annually.",
                                        samplingEffortValue = "6",
                                        samplingEffortUnit = "minutes per point-count survey",
                                        samplingPerformedBy = tapply(
                                          bird.occurrence$brd_perpoint$measuredBy,
                                          bird.occurrence$brd_perpoint$pointLocationID,
                                          function(x) paste(sort(unique(x)), collapse = " | ")
                                        )[NEON_point_metadata$pointLocationID]
                                      )
Point Visit Events
Point-count visit events describe individual breeding landbird surveys conducted at a designated point. At this level, we record the survey date and time, observer, detection conditions, and other field information. During each standardized six-minute survey, all birds seen or heard are recorded, including detections used to determine presence or nondetection. These events link the hierarchical survey design to the occurrence records derived from individual bird observations.
Mapping Event core fields for the point visit event level:
added_point_visit_data_core <- data.frame(eventID = bird.occurrence$brd_perpoint$pointSurveyID,
                                          parentEventID = bird.occurrence$brd_perpoint$pointLocationID,
                                          fieldNumber = NA,
                                          habitat = bird.occurrence$brd_perpoint$observedHabitat,
                                          locationID = bird.occurrence$brd_perpoint$pointLocationID,
                                          countryCode = "US",
                                          decimalLatitude = bird.occurrence$brd_perpoint$decimalLatitude,
                                          decimalLongitude = bird.occurrence$brd_perpoint$decimalLongitude,
                                          coordinateUncertaintyInMeters = bird.occurrence$brd_perpoint$coordinateUncertainty,
                                          geodeticDatum = "WGS84",
                                          locality = bird.occurrence$brd_perpoint$pointLocationID,
                                          minimumElevationInMeters = bird.occurrence$brd_perpoint$elevation - bird.occurrence$brd_perpoint$elevationUncertainty,
                                          maximumElevationInMeters = bird.occurrence$brd_perpoint$elevation + bird.occurrence$brd_perpoint$elevationUncertainty,
                                          verbatimElevation = paste(bird.occurrence$brd_perpoint$elevation, "m", sep=""),
                                          sampleSizeValue = NA,
                                          sampleSizeUnit = NA,
                                          footprintWKT = NA,
                                          footprintSRS = NA,
                                          eventDate = paste(bird.occurrence$brd_perpoint$eventDate),
                                          eventTime = ifelse(
                                            bird.occurrence$brd_perpoint$samplingImpractical == "OK",
                                            paste0(
                                              format(bird.occurrence$brd_perpoint$startDate, "%H:%M:%S"),
                                              "/",
                                              format(
                                                bird.occurrence$brd_perpoint$startDate + lubridate::minutes(6),
                                                "%H:%M:%S"
                                              )
                                            ),
                                            format(bird.occurrence$brd_perpoint$startDate, "%H:%M:%S")
                                          ),
                                          eventType = "site visit",
                                          samplingProtocol = "Point-count Survey",
                                          dataGeneralizations = NA,
                                          informationWithheld = NA,
                                          fieldNotes = NA,
                                          eventRemarks = bird.occurrence$brd_perpoint$remarks,
                                          identifiedBy = bird.occurrence$brd_perpoint %>%
                                            left_join(
                                              bird.occurrence$brd_countdata %>%
                                                group_by(pointSurveyID) %>%
                                                summarise(
                                                  identifiedBy = paste(sort(unique(identifiedBy)), collapse = " | "),
                                                  .groups = "drop"
                                                ),
                                              by = "pointSurveyID"
                                            ) %>%
                                            pull(identifiedBy)
                                        )
Mapping Humboldt extension fields for the point visit event level:
added_point_visit_data_humboldt <- data.frame(eventID = bird.occurrence$brd_perpoint$pointSurveyID,
siteNestingDescription = "One designated breeding landbird point-count location",
siteCount = 1,
verbatimSiteNames = bird.occurrence$brd_perpoint$pointLocationID,
verbatimSiteDescriptions = NA,
reportedWeather = apply(
data.frame(
cloudStart = ifelse(
is.na(bird.occurrence$brd_perpoint$startCloudCoverPercentage),
NA,
paste0("Cloud cover start: ",
bird.occurrence$brd_perpoint$startCloudCoverPercentage, "%")
),
cloudEnd = ifelse(
is.na(bird.occurrence$brd_perpoint$endCloudCoverPercentage),
NA,
paste0("Cloud cover end: ",
bird.occurrence$brd_perpoint$endCloudCoverPercentage, "%")
),
rhStart = ifelse(
is.na(bird.occurrence$brd_perpoint$startRH),
NA,
paste0("Relative humidity start: ",
bird.occurrence$brd_perpoint$startRH, "%")
),
rhEnd = ifelse(
is.na(bird.occurrence$brd_perpoint$endRH),
NA,
paste0("Relative humidity end: ",
bird.occurrence$brd_perpoint$endRH, "%")
),
temp = ifelse(
is.na(bird.occurrence$brd_perpoint$observedAirTemp),
NA,
paste0("Air temperature: ",
bird.occurrence$brd_perpoint$observedAirTemp, " C")
),
wind = ifelse(
is.na(bird.occurrence$brd_perpoint$kmPerHourObservedWindSpeed),
NA,
paste0("Wind speed: ",
bird.occurrence$brd_perpoint$kmPerHourObservedWindSpeed, " km/h")
)
),
1,
function(x) {
x <- x[!is.na(x)]
if (length(x) == 0) NA_character_ else paste(x, collapse = "; ")
}
),
reportedExtremeConditions = ifelse(
is.na(bird.occurrence$brd_perpoint$samplingImpractical) | bird.occurrence$brd_perpoint$samplingImpractical == "OK", NA,
paste0(bird.occurrence$brd_perpoint$samplingImpractical, ", sampling impractical")
),
totalAreaSampledValue = NA,
totalAreaSampledUnit = NA,
geospatialScopeAreaValue = NA,
geospatialScopeAreaUnit = NA,
isVegetationCoverReported = "false",
eventDurationValue = ifelse(
bird.occurrence$brd_perpoint$samplingImpractical == "OK",
6,
NA
),
eventDurationUnit = ifelse(
bird.occurrence$brd_perpoint$samplingImpractical == "OK",
"min",
NA
),
inventoryTypes = NA,
compilationTypes = NA,
compilationSourceTypes = NA,
protocolNames = "Point-count Survey",
protocolDescriptions = "Breeding landbirds are surveyed during standardized six-minute point counts conducted during the breeding season. Field crews visit designated point-count locations and record all birds seen or heard, including taxonomic identification and detection method. Large sites contain 3 x 3 grids of nine points spaced 250 m apart and are surveyed once per year, while small sites contain randomly distributed points spaced at least 250 m apart and are surveyed twice per year.",
protocolReferences = "Esposito, R. 2024. TOS Protocol and Procedure: BRD – Breeding Landbird Abundance and Diversity. NEON.DOC.014041. NEON (National Ecological Observatory Network).",
isAbsenceReported = NA,
absentTaxa = NA,
isAbundanceReported = "true",
isAbundanceCapReported = "false",
abundanceCap = NA,
hasMaterialSamples = "false",
materialSampleTypes = NA,
hasVouchers = "false",
voucherInstitutions = NA,
isLeastSpecificTargetCategoryQuantityInclusive = "false",
verbatimTargetScope = "birds",
targetTaxonomicScope = "Aves",
excludedTaxonomicScope = NA,
isTaxonomicScopeFullyReported = "true",
taxonCompletenessReported = "notReported",
taxonCompletenessProtocols = "Standardized point-count surveys are designed to detect all diurnal terrestrial breeding landbird species seen or heard during the survey period.",
hasNonTargetTaxa = "false",
areNonTargetTaxaFullyReported = NA,
nonTargetTaxa = NA,
targetLifeStageScope = "adult | juvenile",
excludedLifeStageScope = "egg | nestling",
isLifeStageScopeFullyReported = "true",
targetDegreeOfEstablishmentScope = NA,
excludedDegreeOfEstablishmentScope = NA,
isDegreeOfEstablishmentScopeFullyReported = NA,
targetGrowthFormScope = NA,
excludedGrowthFormScope = NA,
isGrowthFormScopeFullyReported = NA,
hasNonTargetOrganisms = NA,
targetHabitatScope = NA,
excludedHabitatScope = NA,
samplingEffort = "6-minute point count per survey location",
isSamplingEffortReported = "true",
samplingEffortProtocol = "Birds are surveyed using standardized 6-minute point counts at each sampling location. Field crews record all birds seen or heard during the survey. Large sites contain 5–10 plots with nine points per grid and are surveyed once annually, while small sites contain 2–25 point-count locations and are surveyed twice annually.",
samplingEffortValue = "6",
samplingEffortUnit = "minutes per point-count survey",
samplingPerformedBy = bird.occurrence$brd_perpoint$measuredBy
)Merge Event Tables
event_data_core <- bind_rows(
  NEON_project_event_core,
  added_domain_data_core,
  added_site_data_core,
  added_plot_data_core,
  added_point_data_core,
  added_point_visit_data_core
)

event_data_humboldt <- bind_rows(
  NEON_project_event_humboldt,
  added_domain_data_humboldt,
  added_site_data_humboldt,
  added_plot_data_humboldt,
  added_point_data_humboldt,
  added_point_visit_data_humboldt
)

rownames(event_data_core) <- NULL
event_data_core <- event_data_core %>% select(where(~ !all(is.na(.)))) #Remove columns that are entirely NA

rownames(event_data_humboldt) <- NULL
event_data_humboldt <- event_data_humboldt %>% select(where(~ !all(is.na(.)))) #Remove columns that are entirely NA
Map Occurrence Data
Occurrence data represent the biological entities observed or derived within events.
- Birds observed in the field are represented as observed records identified to species, sex or age where possible. These records only report presences. Absences of birds are instead recorded at the plot visit event level, where a complete lack of observations indicates that no birds were found during sampling.
Bird Occurrences
added_bird_occurrence_data <- data.frame(eventID = bird.occurrence$brd_countdata$pointSurveyID,
                                         occurrenceID = bird.occurrence$brd_countdata$uid,
                                         basisOfRecord = "HumanObservation",
                                         catalogNumber = NA,
                                         scientificName = bird.occurrence$brd_countdata$scientificName,
                                         scientificNameAuthorship = NA,
                                         taxonRank = bird.occurrence$brd_countdata$taxonRank,
                                         taxonID = bird.occurrence$brd_countdata$taxonID,
                                         kingdom = "Animalia",
                                         identificationQualifier = NA,
                                         identificationReferences = bird.occurrence$brd_countdata %>%
                                           left_join(bird.occurrence$brd_references %>%
                                                       select(date, siteID, identificationReferences),
                                                     by = c("eventDate" = "date", "siteID")) %>%
                                           pull(identificationReferences),
                                         identificationRemarks = bird.occurrence$brd_countdata %>%
                                           left_join(bird.occurrence$brd_identificationHistory %>%
                                                       select(identificationHistoryID, remarks, previousTaxonID = taxonID, acceptedTaxonID),
                                                     by = "identificationHistoryID") %>%
                                           mutate(identificationRemarks = ifelse(is.na(identificationHistoryID), NA_character_,
                                             paste0(remarks, "; previous taxonID: ", previousTaxonID, "; accepted taxonID: ", acceptedTaxonID))) %>%
                                           pull(identificationRemarks),
                                         eventDate = paste(bird.occurrence$brd_countdata$eventDate),
                                         eventTime = format(
                                            bird.occurrence$brd_countdata$startDate +
                                              lubridate::minutes(bird.occurrence$brd_countdata$pointCountMinute - 1),
                                            "%H:%M:%S"
                                         ),
                                         occurrenceStatus = ifelse(
                                            bird.occurrence$brd_countdata$targetTaxaPresent == "Y",
                                            "present",
                                            "absent"
                                         ),
                                         organismQuantity = NA, #individualCount is used instead
                                         organismQuantityType = NA, #individualCount is used instead
                                         individualCount = bird.occurrence$brd_countdata$clusterSize,
                                         recordedByID = NA, #This information is in the plot visit event
                                         vernacularName = bird.occurrence$brd_countdata$vernacularName,
                                         sex = ifelse(
                                            bird.occurrence$brd_countdata$sexOrAge %in% c("Male", "Female"),
                                            bird.occurrence$brd_countdata$sexOrAge,
                                            NA_character_
                                         ),
                                         lifeStage = ifelse(
                                            bird.occurrence$brd_countdata$sexOrAge == "Juvenile",
                                            "Juvenile",
                                            ifelse(bird.occurrence$brd_countdata$sexOrAge %in% c("Male", "Female"),
                                                   "Adult", NA_character_)
                                         ),
                                         establishmentMeans = NA,
                                         degreeOfEstablishment = NA,
                                         pathway = NA,
                                         vitality = "alive",
                                         preparations = NA,
                                         institutionID = NA,
                                         identifiedBy = bird.occurrence$brd_countdata$identifiedBy,
                                         occurrenceRemarks = ifelse(
                                            bird.occurrence$brd_countdata$targetTaxaPresent == "N",
                                            "No birds detected during this survey minute",
                                            NA_character_
                                         )
)Map Extended Measurement or Fact Data
Certain details do not fit into the core event or occurrence tables. These are represented in the ExtendedMeasurementOrFact (eMoF) table.
Observer Distance
emof_obdistance_data <- data.frame(eventID = bird.occurrence$brd_countdata$pointSurveyID,
                             occurrenceID = bird.occurrence$brd_countdata$uid,
                             measurementType = "observerDistance",
                             measurementValue = as.character(bird.occurrence$brd_countdata$observerDistance),
                             measurementUnit = "m",
                             measurementRemarks = "Radial distance between the observer and the individual(s) being observed"
)
Detection Method
emof_detect_method_data <- data.frame(eventID = bird.occurrence$brd_countdata$pointSurveyID,
                                     occurrenceID = bird.occurrence$brd_countdata$uid,
                                     measurementType = "detectionMethod",
                                     measurementValue = bird.occurrence$brd_countdata$detectionMethod,
                                     measurementRemarks = "How the individual(s) was (were) first detected by the observer"
)
Visual Confirmation
emof_confirm_data <- data.frame(eventID = bird.occurrence$brd_countdata$pointSurveyID,
                                     occurrenceID = bird.occurrence$brd_countdata$uid,
                                     measurementType = "visualConfirmation",
                                     measurementValue = bird.occurrence$brd_countdata$visualConfirmation,
                                     measurementRemarks = "Whether the individual(s) was (were) seen after the initial detection"
)
Cluster Code
emof_code_data <- data.frame(eventID = bird.occurrence$brd_countdata$pointSurveyID,
                                     occurrenceID = bird.occurrence$brd_countdata$uid,
                                     measurementType = "clusterCode",
                                     measurementValue = bird.occurrence$brd_countdata$clusterCode,
                                     measurementRemarks = "Alphabetic code (A-Z) linked to clusters (groups of individuals of the same species) spanning multiple records"
)Save Data
Full Dataset
The full processed event and occurrence tables generated through this workflow are available in the project repository. NEONBirdstoHumboldt/outputs/full.
write.csv(event_data_core, "outputs/full/event.csv", row.names = FALSE, na = "")
write.csv(event_data_humboldt, "outputs/full/humboldtecologicalinventory.csv", row.names = FALSE, na = "")
write.csv(occurrence_data, "outputs/full/occurrence.csv", row.names = FALSE, na = "")
write.csv(emof_data, "outputs/full/extendedMeasurementOrFact.csv", row.names = FALSE, na = "")
Zipped DwC-A
We also save the full dataset as a DwC-A for publishing.
Write data files:
write.csv(event_data_core, "outputs/zipped/event.csv", row.names = FALSE, na = "")
write.csv(event_data_humboldt, "outputs/zipped/humboldtecologicalinventory.csv", row.names = FALSE, na = "")
write.csv(occurrence_data, "outputs/zipped/occurrence.csv", row.names = FALSE, na = "")
write.csv(emof_data, "outputs/zipped/extendedMeasurementOrFact.csv", row.names = FALSE, na = "")
Create meta.xml files (the file describing the structure of the data):
# function to create fields
make_fields_xml <- function(df, prefix) {
paste0(
' <field index="', seq_along(colnames(df)) - 1,
'" term="', paste0(prefix, colnames(df)), '"/>',
collapse = "\n"
)
}
# Event Core
core_xml <- paste0(
'<core encoding="UTF-8" fieldsTerminatedBy="," linesTerminatedBy="\\n"
fieldsEnclosedBy=""" ignoreHeaderLines="1"
rowType="http://rs.tdwg.org/dwc/terms/Event">
<files>
<location>event.csv</location>
</files>
<id index="0"/>\n',
make_fields_xml(event_data_core, "http://rs.tdwg.org/dwc/terms/"),
'\n</core>\n'
)
# Humboldt Extension
humboldt_xml <- paste0(
'<extension encoding="UTF-8" fieldsTerminatedBy="," linesTerminatedBy="\\n"
fieldsEnclosedBy=""" ignoreHeaderLines="1"
rowType="http://rs.tdwg.org/eco/terms/Event">
<files>
<location>humboldtecologicalinventory.csv</location>
</files>
<coreid index="0"/>\n',
make_fields_xml(event_data_humboldt, "http://rs.tdwg.org/eco/terms/"),
'\n</extension>\n'
)
# Occurrence Extension
occ_xml <- paste0(
'<extension encoding="UTF-8" fieldsTerminatedBy="," linesTerminatedBy="\\n"
fieldsEnclosedBy=""" ignoreHeaderLines="1"
rowType="http://rs.tdwg.org/dwc/terms/Occurrence">
<files>
<location>occurrence.csv</location>
</files>
<coreid index="0"/>\n',
make_fields_xml(occurrence_data, "http://rs.tdwg.org/dwc/terms/"),
'\n</extension>\n'
)
# extendedMeasurementOrFact Extension
emof_xml <- paste0(
'<extension encoding="UTF-8" fieldsTerminatedBy="," linesTerminatedBy="\\n"
fieldsEnclosedBy=""" ignoreHeaderLines="1"
rowType="http://rs.tdwg.org/dwc/terms/MeasurementOrFact">
<files>
<location>extendedMeasurementOrFact.csv</location>
</files>
<coreid index="0"/>\n',
make_fields_xml(emof_data, "http://rs.tdwg.org/dwc/terms/"),
'\n</extension>\n'
)
# Put everything together
meta_xml <- paste0(
'<?xml version="1.0" encoding="UTF-8"?>
<archive xmlns="http://rs.tdwg.org/dwc/text/" metadata="eml.xml">
',
core_xml,
humboldt_xml,
occ_xml,
emof_xml,
'</archive>'
)
writeLines(meta_xml, "outputs/zipped/meta.xml")Create eml.xml files (dataset metadata file):
library(uuid)
package_id <- paste0(UUIDgenerate())

alternate_id_block <- paste0(
'    <alternateIdentifier>10.15468/3vd2zk</alternateIdentifier>\n',
'    <alternateIdentifier>516eb7c0-3586-4dfc-bc18-c1fc1e765b7f</alternateIdentifier>\n'
)

title <- "NEON Breeding landbird point counts"
pub_date <- Sys.Date()
language <- "eng"

creator_block <- paste0(
'    <creator id="5b77bf2d-3bb2-4cb3-9f9d-50c20357f4cb">
      <organizationName>NEON Biorepository Portal</organizationName>
      <electronicMailAddress>biorepo@asu.edu</electronicMailAddress>
    </creator>\n'
)

metadata_provider_block <- paste0(
'    <metadataProvider>
      <organizationName>NEON Biorepository Portal</organizationName>
      <electronicMailAddress>biorepo@asu.edu</electronicMailAddress>
    </metadataProvider>\n'
)

abstract_text <- paste(
  "This dataset contains quality-controlled breeding landbird survey data collected by the U.S. National Ecological Observatory Network (NEON) across terrestrial sites in the United States as part of a long-term ecological monitoring program.",
  "Birds are surveyed using standardized 6-minute point counts during the breeding season, during which trained observers record all individuals seen or heard. Records include species identifications and metadata used to account for detectability, including distance from the observer, detection method, and weather conditions.",
  "Sampling is spatially distributed across NEON sites using 9-point grids or individually distributed points, with repeated sampling at smaller sites. Point-count locations are spaced at least 250 m apart.",
  "The dataset is structured as a hierarchical survey using the Darwin Core Event Core and the Humboldt Extension for Ecological Inventories, with events defined at project, domain, site, plot, point, and point-count survey levels. Occurrence records represent bird detections and nondetections recorded during individual survey minutes.",
  "For additional details, see https://data.neonscience.org/data-products/DP1.10003.001."
)

abstract_block <- paste0(
'    <abstract>
      <para>', abstract_text, '</para>
    </abstract>\n'
)

contact_block <- paste0(
'    <contact>
      <individualName>
          <givenName>Chandra</givenName>
          <surName>Earl</surName>
      </individualName>
      <organizationName>National Ecological Observatory Network Biorepository</organizationName>
      <positionName>Biodiversity Informatician</positionName>
      <address>
        <deliveryPoint>734 W. Alameda Drive Suite 158, DC 4108</deliveryPoint>
        <city>Tempe</city>
        <administrativeArea>AZ</administrativeArea>
        <postalCode>85282</postalCode>
        <country>US</country>
      </address>
      <electronicMailAddress>biorepo@asu.edu</electronicMailAddress>
    </contact>\n'
)

methods_block <- paste0(
'    <methods>

      <methodStep>
        <description>
          <para>
            Data were compiled from the National Ecological Observatory Network (NEON) data portal. Source data included field sampling records and observations. Additional domain- and site-level metadata were obtained from NEON geospatial products and the NEON API, including domain boundary shapefiles and site metadata downloads.
          </para>
        </description>
      </methodStep>

      <methodStep>
        <description>
          <para>
            Event-level data were constructed to represent a hierarchical sampling design, with events defined at project, domain, site, plot, point, and sampling visit levels. Event records were generated by combining NEON metadata with field sampling data and aggregating temporal information to define eventDate ranges at each level.
          </para>
        </description>
      </methodStep>

      <sampling>

        <studyExtent>
          <description>
            <para>
              This dataset includes observations from NEON terrestrial field sites distributed across multiple ecoclimatic domains in the United States, including Alaska, Hawaii and Puerto Rico. Sampling occurs at fixed plots within each site as part of NEON’s long-term ecological monitoring program.
            </para>
          </description>
        </studyExtent>

        <samplingDescription>
          <para>
            Breeding landbirds are surveyed using standardized 6-minute point counts at established sampling locations during the breeding season. Observers record all birds seen or heard, including species, detection method, and horizontal distance from the observer. Point counts are distributed in 9-point grids with 250 m spacing at larger sites or as individually distributed points at smaller sites, where surveys are repeated within the breeding season.
          </para>
        </samplingDescription>

      </sampling>

      <methodStep>
        <description>
          <para>
            The dataset is structured as a hierarchical survey using the Darwin Core Event Core, with events defined at project, domain, site, plot, point, and sampling visit levels. Event-level data were split into two components: a Darwin Core Event Core table and a Humboldt Extension table describing ecological inventory context, including sampling effort, taxonomic scope, and protocol details.
          </para>
        </description>
      </methodStep>

      <methodStep>
        <description>
          <para>
            Occurrence records include bird observations. Additional contextual data, including observer distance, detection method, visual confirmation and cluster code were mapped to the Extended Measurement or Fact (eMoF) extension. All data were formatted according to Darwin Core standards for publication as a Darwin Core Archive.
          </para>
        </description>
      </methodStep>

      <qualityControl>
        <description>
          <para>
            Quality control procedures were implemented during data collection, ingestion, and processing within NEON systems. Data values were validated through controlled vocabularies and standardized formats, and additional transformations were applied during dataset preparation to ensure consistency, completeness, and correct linkage between events, occurrences, and derived records.
          </para>
        </description>
      </qualityControl>

    </methods>\n'
)

rights_block <- paste0(
'    <intellectualRights>
      <para>
        This work is licensed under the
        <ulink url="https://creativecommons.org/licenses/by/4.0/">
          <citetitle>Creative Commons Attribution 4.0 International (CC BY 4.0)</citetitle>
        </ulink>
      </para>
    </intellectualRights>\n'
)

maintenance_block <- paste0(
'    <maintenance>
      <description>
        <para>NEON datasets are updated annually upon the yearly release</para>
      </description>
      <maintenanceUpdateFrequency>annually</maintenanceUpdateFrequency>
    </maintenance>\n'
)

start_date <- min(as.Date(event_data_core$eventDate), na.rm = TRUE)
end_date <- max(as.Date(event_data_core$eventDate), na.rm = TRUE)

coverage_block <- paste0(
'    <coverage>

      <geographicCoverage>
        <geographicDescription>
          Data are collected at 47 terrestrial NEON sites across the United States including Alaska, Hawaii and Puerto Rico.
        </geographicDescription>
        <boundingCoordinates>
          <westBoundingCoordinate>-168.75</westBoundingCoordinate>
          <eastBoundingCoordinate>-65.391</eastBoundingCoordinate>
          <northBoundingCoordinate>71.301</northBoundingCoordinate>
          <southBoundingCoordinate>15.623</southBoundingCoordinate>
        </boundingCoordinates>
      </geographicCoverage>

      <temporalCoverage>
        <rangeOfDates>
          <beginDate>
            <calendarDate>', start_date, '</calendarDate>
          </beginDate>
          <endDate>
            <calendarDate>', end_date, '</calendarDate>
          </endDate>
        </rangeOfDates>
      </temporalCoverage>

      <taxonomicCoverage>
        <generalTaxonomicCoverage>
          This dataset covers breeding landbirds at NEON terrestrial sites, primarily including songbirds and other diurnal birds resident in or migrating through terrestrial habitats. Birds observed in these habitats, including raptors and waterfowl, may also be included.
        </generalTaxonomicCoverage>

        <taxonomicClassification>
          <taxonRankName>Class</taxonRankName>
          <taxonRankValue>Aves</taxonRankValue>
          <commonName>birds</commonName>
        </taxonomicClassification>

      </taxonomicCoverage>

    </coverage>\n'
)

project_block <- paste0(
"    <project>

      <title>National Ecological Observatory Network</title>

      <personnel>
        <individualName>
          <givenName>Kate</givenName>
          <surName>Thibault</surName>
        </individualName>
        <userId directory=\"http://orcid.org/\">0000-0003-3477-6424</userId>
        <role>ADMINISTRATIVE_POINT_OF_CONTACT</role>
      </personnel>

      <abstract>
        <para>
          The National Science Foundation's National Ecological Observatory Network (NEON) is a continental-scale ecological observation facility, fully funded by NSF and operated by Battelle. NEON collects and provides open data from 81 field sites across the United States that characterize and quantify how our nation's ecosystems are changing. Each year, NEON collects and archives over 100,000 specimens and samples that complement the field observations and automated measurements collected at field sites. These samples represent a rich resource unique among natural history collections due to NEON's utility for continental- and decadal-scale ecology. NEON's archival samples are available upon request to support research studies and analyses. The comprehensive data, spatial extent and remote sensing technology provided by the NEON project will contribute to a better understanding and more accurate forecasting of how human activities impact ecology and how our society can more effectively address critical ecological questions and issues.
        </para>
      </abstract>

      <funding>
        <para>National Science Foundation, Award DBI-2217817</para>
      </funding>

      <studyAreaDescription>
        <descriptor name=\"generic\" citableClassificationSystem=\"false\">
          <descriptorValue>United States including Alaska, Hawaii and Puerto Rico</descriptorValue>
        </descriptor>
      </studyAreaDescription>

    </project>\n"
)

additional_description_block <- paste0(
'    <purpose>
      <para>
        The purpose of this dataset is to make breeding landbird monitoring data from the National Ecological Observatory Network (NEON) available through GBIF. The data have been structured using the Darwin Core standard and the Humboldt Extension for Ecological Inventories to support discovery, reuse, integration, and ecological analysis. Code used to transform the original NEON data into this Darwin Core Archive, including all data processing and mapping steps, is available at
        <ulink url="https://BioKIC.github.io/NEONBirdstoHumboldt/"><citetitle>NEON Birds to Humboldt workflow</citetitle></ulink>.
      </para>
    </purpose>

    <introduction>
      <para>
        The workflow produces four Darwin Core tables: Event, HumboldtEcologicalInventory, Occurrence, and ExtendedMeasurementOrFact. The dataset is structured hierarchically, with events defined at multiple levels (project, domain, site, plot, point, and point visit). Occurrences represent observed birds. Contextual information on sampling design, effort, and scope is expressed through Humboldt Extension terms.
      </para>

      <para>
        The U.S. National Science Foundation’s National Ecological Observatory Network (NEON) carries out long-term, standardized monitoring of breeding landbirds across terrestrial sites in the United States. Birds are surveyed during the breeding season using standardized six-minute point counts. Observers record birds seen or heard and collect information including species identification, detection method, distance from the observer, sex and age when possible, and environmental conditions.
      </para>

      <para>
        Bird sampling is spatially distributed across NEON terrestrial sites. At most sites, sampling locations are arranged in 3 x 3 grids of nine points spaced 250 m apart. At sites that cannot accommodate these grids, individual points are distributed throughout the site with a minimum spacing of 250 m. Additional details on NEON’s breeding landbird monitoring program are available from the NEON bird resource page
        (<ulink url="https://www.neonscience.org/data-collection/birds"><citetitle>NEON bird data resource</citetitle></ulink>)
        and associated protocols in the NEON Document Library
        (<ulink url="https://data.neonscience.org/documents"><citetitle>NEON Document Library</citetitle></ulink>).
      </para>

      <para>
        NEON biological datasets are organized as hierarchical structures that reflect the standardized design of the survey program. Locality information is captured at multiple spatial scales, including domains, sites, plots, and point-count locations. Sampling context is described using the Darwin Core Event Core and Humboldt Extension, while measurements associated with bird observations are recorded using the Extended Measurement or Fact (eMoF) extension. Occurrence records are linked to point-count survey events to represent bird detections and nondetections.
      </para>
    </introduction>

    <gettingStarted>
      <para>
        The dataset is provided as a Darwin Core Archive consisting of an Event Core file and associated extensions, including HumboldtEcologicalInventory, Occurrence, MeasurementOrFact, and a Humboldt Extension table describing ecological inventory context. These components are linked through shared identifiers such as eventID and occurrenceID.
      </para>
    </gettingStarted>\n'
)

dataset_block <- paste0(
  '  <dataset>\n\n',
  alternate_id_block,
  '    <title xml:lang="eng">', title, '</title>\n\n',
  creator_block,
  metadata_provider_block,
  '    <pubDate>', pub_date, '</pubDate>\n',
  '    <language>', language, '</language>\n\n',
  abstract_block,
  rights_block,
  coverage_block,
  additional_description_block,
  maintenance_block,
  contact_block,
  methods_block,
  project_block,
  '  </dataset>\n'
)

date_stamp <- format(Sys.time(), "%Y-%m-%dT%H:%M:%SZ", tz = "UTC")

additional_metadata_block <- paste0(
'  <additionalMetadata>
    <metadata>
      <gbif>
        <dateStamp>', date_stamp, '</dateStamp>
        <hierarchyLevel>dataset</hierarchyLevel>
        <physical>
            <objectName>Breeding landbird point counts</objectName>
            <characterEncoding>UTF-8</characterEncoding>
            <dataFormat>
                <externallyDefinedFormat>
                    <formatName>CSV</formatName>
                </externallyDefinedFormat>
            </dataFormat>
            <distribution>
                <online>
                    <url function="download">https://data.neonscience.org/data-products/DP1.10003.001</url>
                </online>
            </distribution>
        </physical>

      </gbif>
    </metadata>
  </additionalMetadata>\n'
)

header_block <- paste0(
'<?xml version="1.0" encoding="UTF-8"?>
<eml:eml xmlns:eml="https://eml.ecoinformatics.org/eml-2.2.0"
         xmlns:dc="http://purl.org/dc/terms/"
         xmlns:xsi="http://www.w3.org/2001/XMLSchema-instance"
         xsi:schemaLocation="https://eml.ecoinformatics.org/eml-2.2.0 https://rs.gbif.org/schema/eml-gbif-profile/1.3/eml.xsd"
         packageId="', package_id, '" system="http://gbif.org" scope="system"
         xml:lang="eng">\n\n'
)

footer_block <- '</eml:eml>'

eml_xml <- paste0(
  header_block,
  dataset_block,
  additional_metadata_block,
  footer_block
)

writeLines(eml_xml, "outputs/zipped/eml.xml")
Zip files to a DwC-A:
output_zip <- "outputs/zipped/DwC-A.zip"

if (file.exists(output_zip)) {
  unlink(output_zip)
}

file_paths <- list.files("outputs/zipped", full.names = TRUE)
zip(zipfile = output_zip, files = file_paths, flags = "-j" )

if (file.exists(output_zip)) {
  unlink(file_paths)
}